誰說 ERP 資料只能在電腦上用 Excel 分析?iDempiere Mobile 全新三大檢視模式,讓你在手機上就能完成表格瀏覽、圖表分析、樞紐交叉分析——開會時掏出手機秀數據,同事以為你偷帶了筆電。
表格 + 欄位自訂
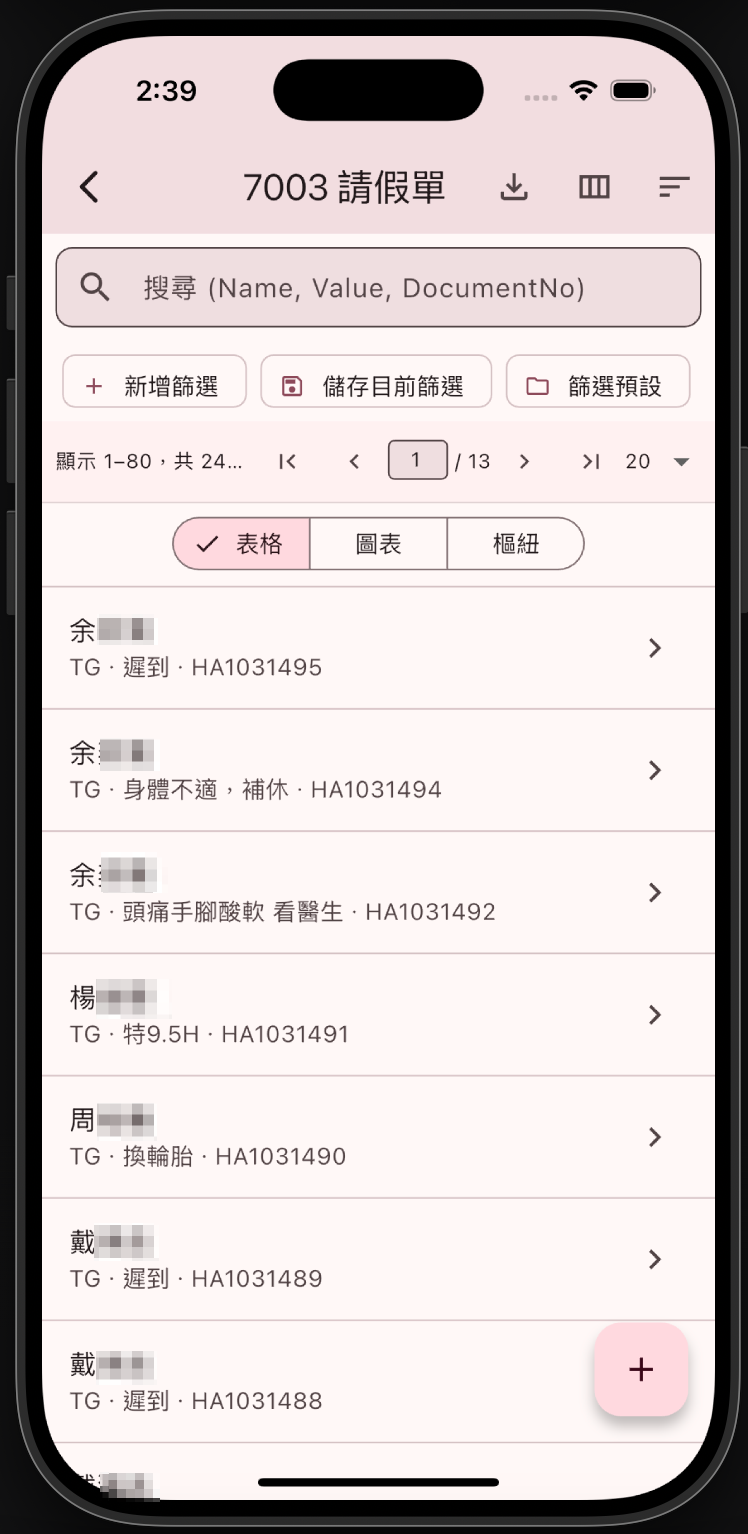
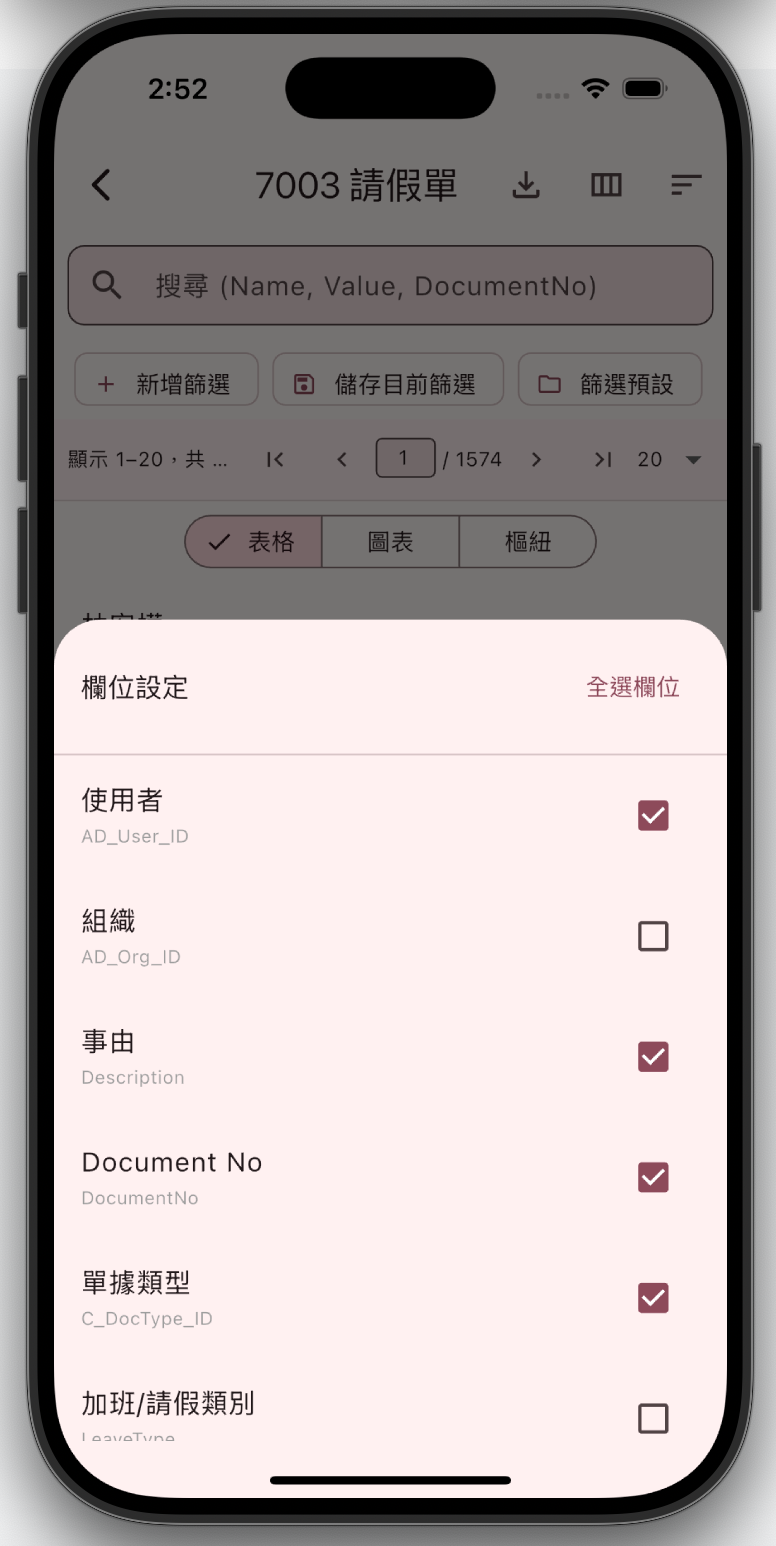
經典列表模式全面升級——新增進階篩選(新增條件 / 儲存篩選 / 載入預設),搭配欄位自訂功能,想看什麼勾什麼,不看的通通藏起來,畫面乾淨到強迫症都流淚。
圖表分析
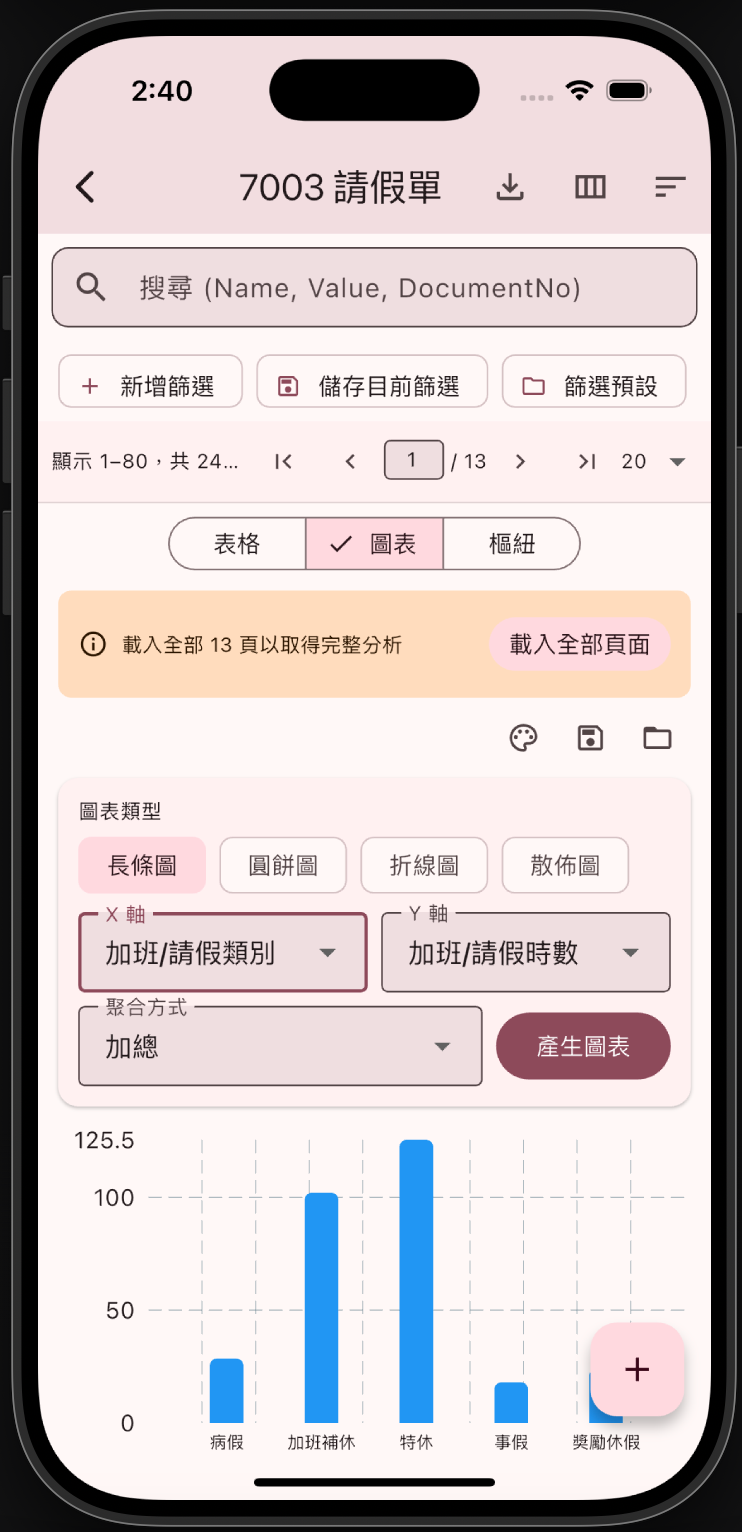
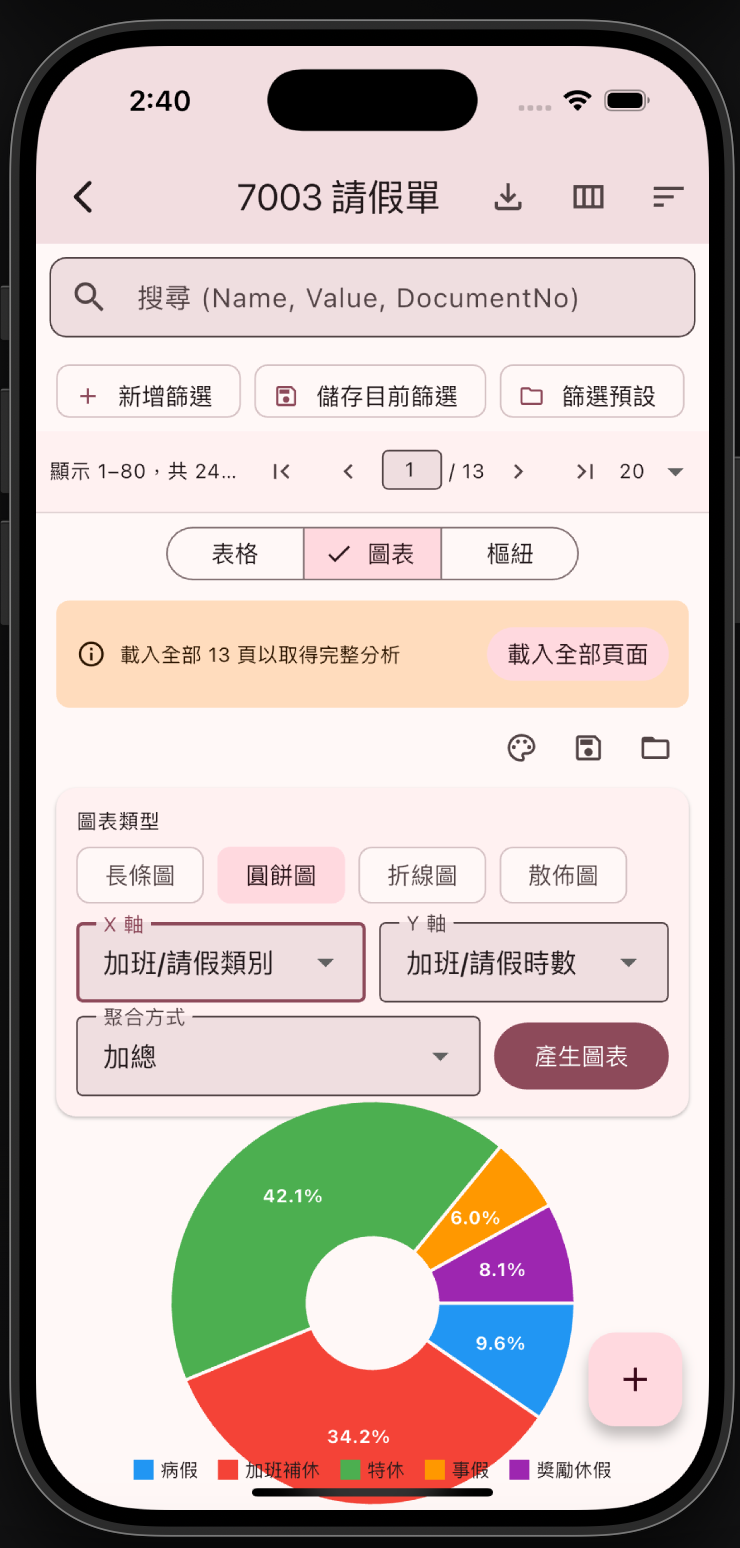
切到「圖表」頁籤,選 X 軸、Y 軸和聚合方式,一鍵產生長條圖、圓餅圖、折線圖、散佈圖。老闆問你部門數據?甩一張圖表出來,氣場直接拉滿。
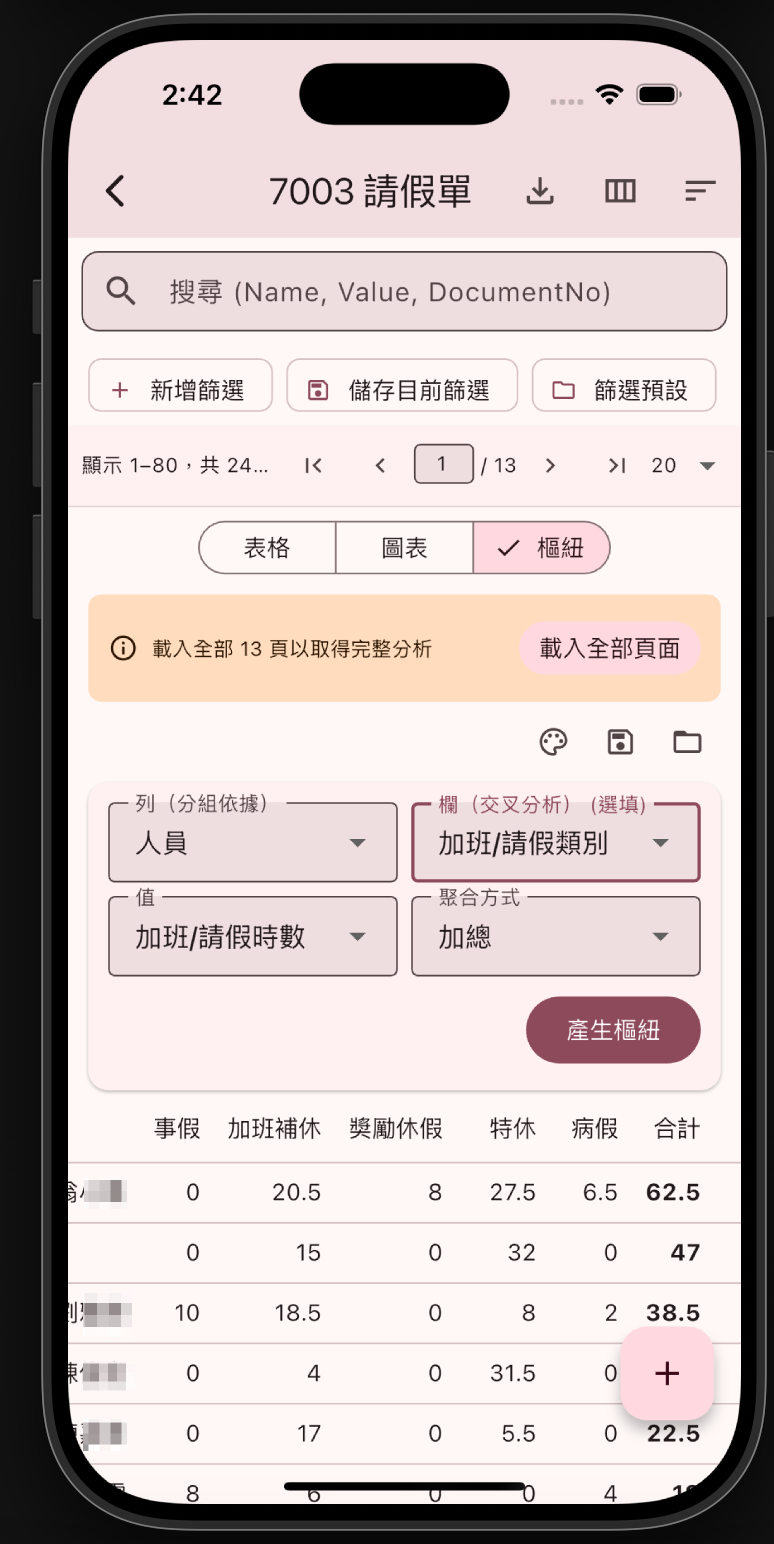
樞紐交叉分析
Excel 的樞紐分析表搬到手機上了!選擇「列」(分組依據)、「欄」(交叉分析)、「值」和「聚合方式」,一鍵產生交叉分析表。會議上掏出手機直接秀數據,誰還需要帶筆電?

功能重點一覽
| 檢視模式 | 功能亮點 |
|---|---|
| 表格 | 即時搜尋、進階篩選(新增/儲存/預設)、欄位自訂、分頁載入 |
| 圖表 | 四種圖表類型、自選 X/Y 軸、聚合方式、一鍵產生 |
| 樞紐 | 列/欄/值自由設定、多種聚合、交叉分析表即時產生 |
🌐 English Version
Who says ERP data analysis requires a desktop and Excel? iDempiere Mobile’s brand-new three view modes let you browse tables, analyze charts, and create pivot tables — all from your phone. Whip it out in a meeting and your colleagues will think you smuggled in a laptop.
Table + Column Customization
The classic list view, fully upgraded — now with advanced filters (add conditions / save filters / load presets) and column customization. Pick what you want to see, hide the rest. Neat freaks everywhere are shedding tears of joy.
Chart Analysis
Switch to the Chart tab, pick X-axis, Y-axis, and aggregation, then generate bar charts, pie charts, line charts, or scatter plots in one tap. Boss asks for department stats? Flash a chart and drop the mic.
Pivot Table Analysis
Excel’s pivot tables — now on your phone! Pick rows, columns, values, and aggregation method, then generate a cross-analysis table in one tap. Pull out your phone in a meeting — who needs a laptop?
Feature Highlights
| View Mode | Highlights |
|---|---|
| Table | Instant search, advanced filters (add/save/presets), column customization, pagination |
| Chart | 4 chart types, custom X/Y axes, aggregation, one-tap generation |
| Pivot | Flexible row/column/value setup, multiple aggregations, instant cross-analysis |
🇯🇵 日本語版
ERPデータ分析にPCとExcelが必要だなんて誰が言った?iDempiere Mobileの新しい3つの表示モードで、スマホだけでテーブル閲覧、グラフ分析、ピボットテーブルが完結。会議で取り出せば、同僚にノートPCを密輸したと思われるかも。
テーブル + カラムカスタマイズ
定番のリスト表示が全面アップグレード —— 高度なフィルター(条件追加 / 保存 / プリセット)とカラムカスタマイズ機能を搭載。見たいものだけ選んで、残りは非表示に。整理好きには天国です。
グラフ分析
グラフタブに切替えて、X軸・Y軸・集計方法を選んで、棒グラフ、円グラフ、折れ線グラフ、散布図をワンタップ生成。上司に「数字は?」と聞かれたらグラフを見せて一撃KO。
ピボットテーブル分析
Excelのピボットテーブルがスマホにも!行・列・値・集計方法を選んで、ワンタップでクロス分析表を生成。会議でスマホを取り出してデータを見せれば、もうノートPCは不要。
機能ハイライト
| 表示モード | 機能ハイライト |
|---|---|
| テーブル | 即時検索、高度なフィルター(追加/保存/プリセット)、カラムカスタマイズ、ページネーション |
| グラフ | 4種類のグラフ、X/Y軸カスタム、集計方法、ワンタップ生成 |
| ピボット | 行/列/値の自由設定、複数の集計方法、リアルタイムクロス分析 |